Which hospitals in my region need the most attention?
The BIG Executive Overview gives you the answers
in minutes, not months
take immediate action
Making Business Analytics Useful
CANADA’S PERFORMANCE BENCHMARKING STANDARD
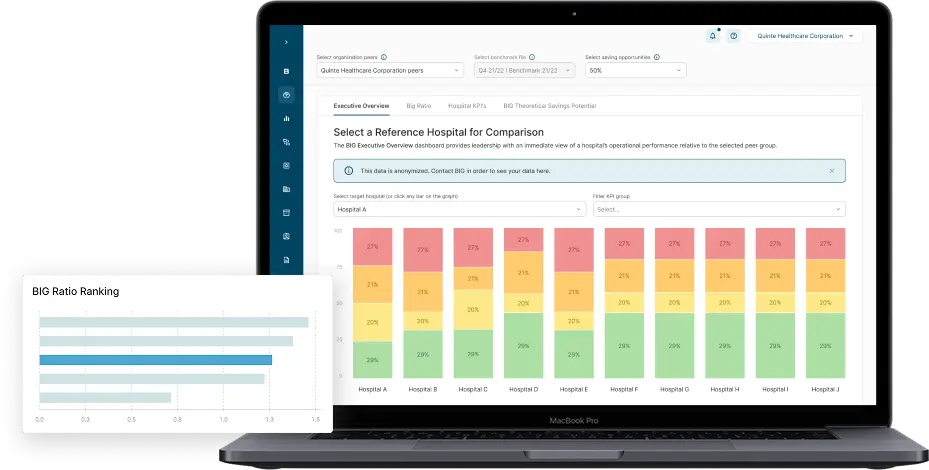
BIG Executive Overview
Designed specifically for executive healthcare leaders, the Executive Overview translates complex operational analytics into hospital-level KPI’s using Canada’s only national operational performance benchmarking standard.
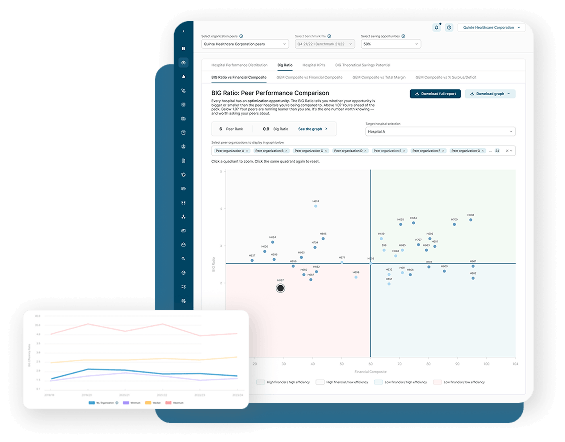
The BIG Ratio
A single, trusted performance metric that answers the question every executive asks: “How different are we from our peers?” Developed by Canada’s foremost experts in operational efficiency, the BIG Ratio is built on a consistent national benchmarking standard — so every hospital, regardless of province, is speaking the same language.
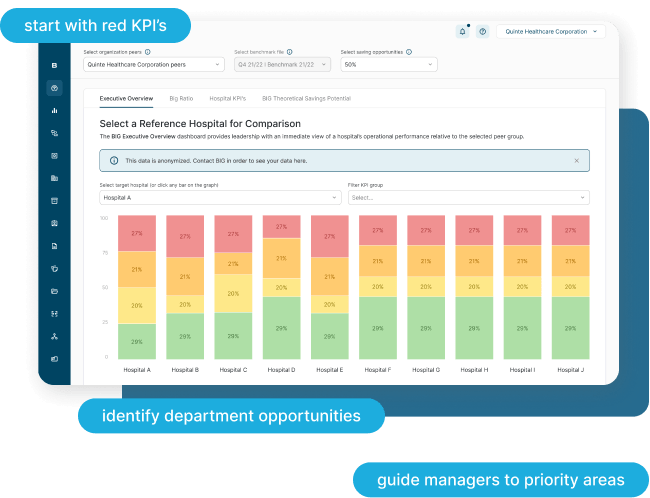
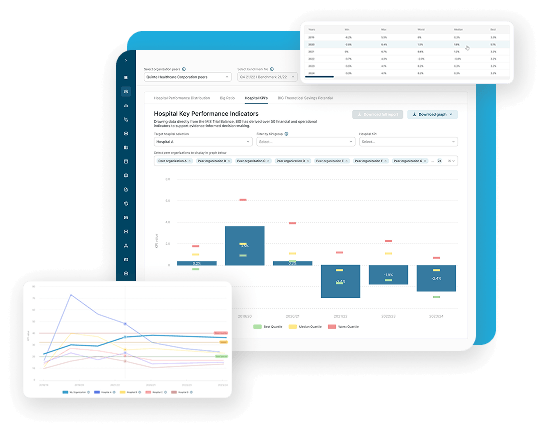
Hospital Key Performance Indicators
Drawing data directly from the MIS Trial Balance, BIG has derived over 50 hospital-level financial and operational indicators to support evidence-informed decision-making.
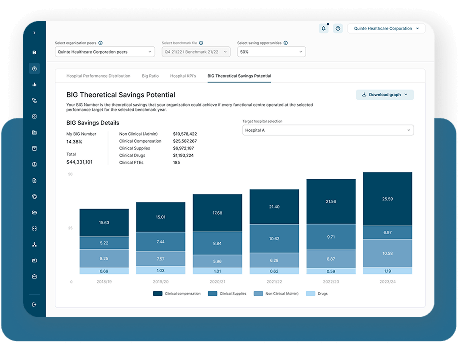
BIG Theoretical Savings Potential
Your BIG Number is the theoretical savings that your organization could achieve if every functional centre operated at the selected performance target — that is, if you were operating at the maximum efficiency of all your peer hospitals. It is not intended to be an achievable goal, rather it provides a big picture, relative opportunity that can drive collaborative peer conversations.
Join Canada’s growing network of hospital executives that are benchmarking with BIG Healthcare
Don’t be the last of your peers to know how your hospital compares. Activate your FREE account and see where you stand — in minutes, not months.
Ready to benchmark?
Schedule a custom demo to see how BIG Healthcare can provide you with actionable insights — in minutes, not months.